A growing number of Americans call themselves ‘pro-choice’ – but what’s really behind it?
Nancy Flanders
·
Abortion in the U.S. drops 12 percent as more mothers choose life
This year, media outlets across America reported a 12% decline in abortion between year 2010 and 2013. The Associated Press first broke the story after analyzing official abortion data from across the country. The news has pro-lifers celebrating and sparked a broader discussion about what has caused the abortion decline. Despite the spin by pro-abortion advocates, and their cheerleaders in the media, the decline in abortion is driven mostly by more mothers choosing life for their babies.
Many pundits and writers have spouted different theories but what has been lacking is a straightforward look at what the data actually says. One claim is that the decline is abortion is simply a factor of fewer women getting pregnant, but the facts do not back this up. Between the reported periods of 2010 to 2013, live births declined by just 1.4%, yet abortion declined by a much greater 12%. If the abortion decline was just a matter of fewer pregnancies then we would expect a similar decline in births.
In 2010, 18% of pregnancies ended in abortion compared to live birth. In 2013, this figure had dropped to 16.4%. This decline in abortion rate accounts for 62,755 fewer abortions. Out of a total abortion decline of 86,529, this mean that 72.5% of the decline was driven by a lower percentage of pregnant women choosing abortion. Now this doesn’t tell us why women were choosing life for their babies, and that can be debated, but it does tell us that fewer pregnancies is not the main factor.
That said, fewer pregnancies were a meaningful factor and account for the remaining 27.5% of the decline. Interestingly, this trend has reversed with live births rising in 2014 and causing CNN to declare an end to the “great baby recession.” Pregnancy rates are impacted by factors such as frequency of sexual activity, fertility, and consistency and effectiveness of contraceptive use.
Article continues below
Dear Reader,
In 2026, Live Action is heading straight where the battle is fiercest: college campuses.
We have a bold initiative to establish 100 Live Action campus chapters within the next year, and your partnership will make it a success!
Your support today will help train and equip young leaders, bring Live Action’s educational content into academic environments, host on-campus events and debates, and empower students to challenge the pro-abortion status quo with truth and compassion.
Invest in pro-life grassroots outreach and cultural formation with your DOUBLED year-end gift!
One other claim is that fewer women choose abortion because the ones that would have aborted are now the ones using contraception or abortifacients. But the data from the CDC doesn’t back this up. In 1982 unintended births were 36.5%. In the latest CDC report on this matter, which is from 2006-2010, unintended births were 37.1%. The unintended pregnancy rate has been just as stubborn as it consistently registers in the high 40s. As Michael J. New pointed out in an article this summer, “according to data from the Guttmacher Institute, the percentage of unintended pregnancies ending in abortion fell from 54 percent in 1994 to 40 percent in 2008.” This tells us that the decline in women choosing abortion is mostly being driven by a change in the response to pregnancy, not in the situations that women find themselves in.
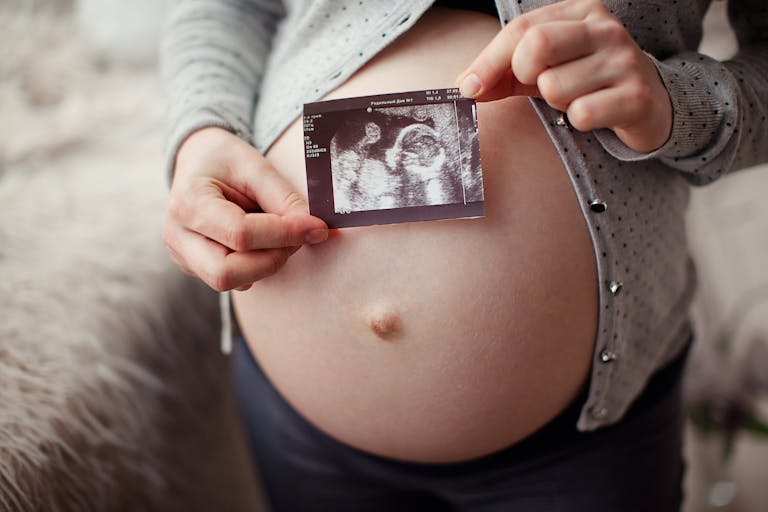
What is clear is that the headlines declaring this abortion decline as merely a factor of less pregnancy are false. Overall since the early 1980s we have seen a steady decrease in the percentage of women choosing abortion from about 29% down to 16.4% today. The big question we should be asking is “why are so many women choosing life”? This questions deserves more study. We think a big part has been the greater visibility of children in the womb thanks to improved ultrasound technology. Combined with growing pro-life advocacy, we see that many Americans now view abortion as a direct assault on human rights.
Data Notes: California, Maryland, New Hampshire, New Jersey, and Wyoming health departments do not report any abortion totals and so they are not included in the analysis by the Associated Press or us. The analysis is based on the reaming 45 states. We hope all states would report comprehensive abortion statistics as this aids public policy discussions. We encourage data scientists as well as interested readers to view our full analysis based on CDC and official state reports at: https://www.liveactionnews.org/wp-content/uploads/2015/07/Abortion_Data_45.pdf
Live Action News is pro-life news and commentary from a pro-life perspective.
Contact editor@liveaction.org for questions, corrections, or if you are seeking permission to reprint any Live Action News content.
Guest Articles: To submit a guest article to Live Action News, email editor@liveaction.org with an attached Word document of 800-1000 words. Please also attach any photos relevant to your submission if applicable. If your submission is accepted for publication, you will be notified within three weeks. Guest articles are not compensated (see our Open License Agreement). Thank you for your interest in Live Action News!

Nancy Flanders
·
Analysis
Nancy Flanders
·
International
Angeline Tan
·
Pop Culture
Cassy Cooke
·
International
Cassy Cooke
·
Analysis
Cassy Cooke
·
Media
The Editors
·
Fact Checks
The Editors
·
Fact Checks
The Editors
·
Analysis
The Editors
·
Politics
The Editors
·