
EU Parliament votes in favor of abortion travel fund
Bridget Sielicki
·
New CDC report shows 57% drop in abortions from record high in 1990
The Centers for Disease Control and Prevention (CDC) just released its latest reported abortion data, which shows a continuing trend of decreasing abortion numbers as well as abortion rates.
In the most recently reported year of 2018, the CDC reported 619,591 abortions, up slightly from 2017’s total of 612,719, but a drop of nearly 57% from its highest peak of 1,429,247 abortions in 1990. The year prior, in 2016, the CDC reported 623,471 abortions.
Reasons for uptick
According to Dr. Michael New who analyzed the data at National Review Online, the increase may be associated with relaxed label changes to the abortion pill by the FDA in 2016, allowing for chemical abortions later in pregnancy. Dr. New also pointed to policy changes at the state level, including expanding taxpayer-funded abortion, documented to increase abortions.
“It is worth noting that, while CDC statistics indicate that between 2017 and 2018, the number of abortions increased in 27 of the 46 states reporting data for both years, in many cases, these abortion increases were small. But since a majority of states did report abortion increases, it is likely that other factors in addition to public policy contributed to the overall abortion rate increase,” Dr. New wrote.
“It is certainly possible that the recent uptick in the U.S. abortion rate might simply represent a short-term, temporary increase and that the long-term downward trend of the last few decades will continue in the future. Even though the abortion rate has fallen fairly consistently since 1980, there have been a few years when there it increased slightly,” he also added.
Comparing 2018 abortion numbers to those that took place in 1973 when Roe v. Wade legalized abortion throughout the US, the numbers are shockingly similar, with 2018’s numbers surpassing 1973’s (615,831) by about 4,000 abortions. In addition, the 2018 data shows that over the past 10 years (825,564 in 2008 v. 619,591 in 2018), abortions reported to the CDC have dropped by nearly 25%.
Abortion rate and ratio
In 2018, abortion data was sent to the CDC from a total of 49 reporting areas (47 states, the District of Columbia, and New York City, excluding California, Maryland, and New Hampshire), an increase in one reporting area since 2009. However, in 2018, the CDC used the previous 48 continuously reporting areas to calculate the 2018 abortion rate of 11.3 abortions per 1,000 women aged 15–44 years and ratio at 189 (number of abortions per 1,000 live births).
The good news is that in 2018, the abortion rate showed a decline of nearly 53% from where it was in 1990 (24 v. 11.3), and a decrease of 19% (19.29%) since 1973 (14 v. 11.3).
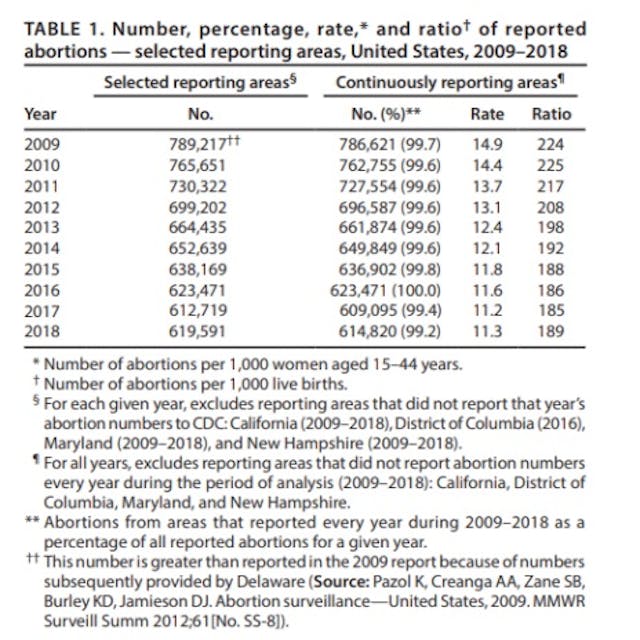
The Charlotte Lozier Institute’s Dr. Michael New published a tweet about the data, noting that among continuously reporting areas between 2016 and 2018, there was:
A 2.5% decline in the U.S. abortion rate.
A 1.4% decline in the number of abortions performed.
“The decline was widespread. Of the 45 states that reported abortion data in 2016 and 2018 — 29 saw their abortion rates decline. Since 2009, there has been a 24.2 percent decline in the abortion rate and a 21.8 percent decline in the number of abortions performed. The U.S. abortion rate has declined by over 50% since 1980,” Dr. New noted.
“The main reason why abortion rates are falling is not because there are fewer unintended pregnancies. In fact, the unintended pregnancy rate has fluctuated since 1981. An important reason is that a higher percentage of unintended pregnancies are being carried to term. This shows the pro-life educational, service, and yes, legislative efforts have all been effective at reducing the incidence of abortion,” Dr. New previously stated.
Abortion-related deaths
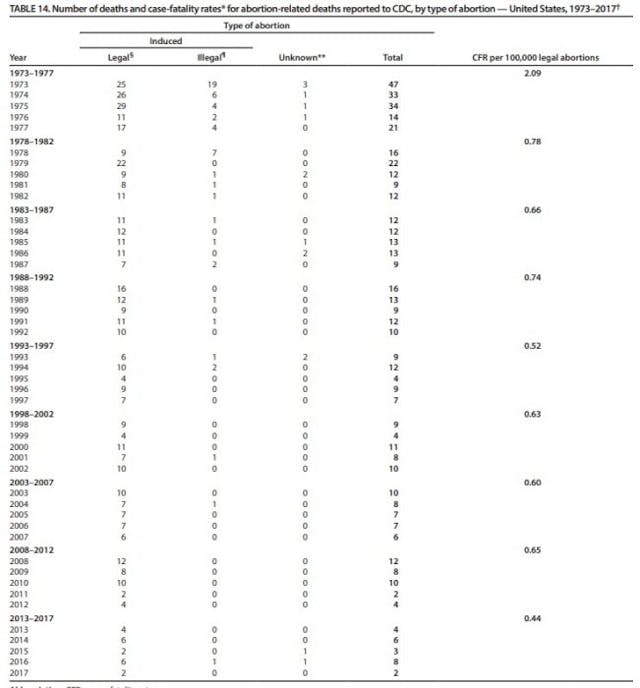
The CDC defines an abortion-related death as a “death resulting from a direct complication of an abortion (legal or illegal), an indirect complication caused by a chain of events initiated by an abortion, or an aggravation of a preexisting condition by the physiologic or psychologic effects of abortion.” While the CDC has not finalized the number of abortion-related deaths for 2018, the report indicates that two abortion-related deaths occurred in 2017 and eight in 2016 (this includes one categorized as an illegal abortion and another as unknown). The CDC report acknowledges that between 1998 and 2017, “eight states did not report abortion data every year during this period.”
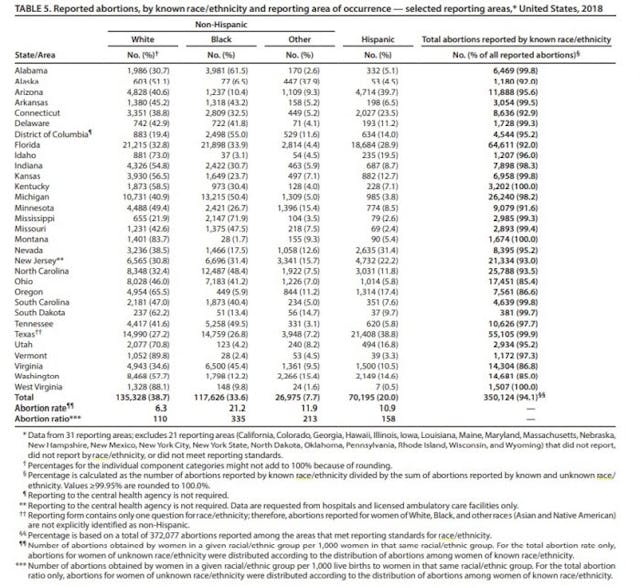
Race/Ethnicity (31 reporting areas)
Article continues below
Dear Reader,
In 2026, Live Action is heading straight where the battle is fiercest: college campuses.
We have a bold initiative to establish 100 Live Action campus chapters within the next year, and your partnership will make it a success!
Your support today will help train and equip young leaders, bring Live Action’s educational content into academic environments, host on-campus events and debates, and empower students to challenge the pro-abortion status quo with truth and compassion.
Invest in pro-life grassroots outreach and cultural formation with your DOUBLED year-end gift!
White and Black women still accounted for the largest percentage of abortions among the 31 reporting areas which sent data on race and ethnicity to the CDC. Using these percentages against the total of 619,591 abortions reported to the CDC for 2018, Live Action News estimates the following:
Non-Hispanic white women: (38.7%) – 239,782 estimated abortions.
Non-Hispanic Black women: (33.6%) – 208,183 estimated abortions.
Hispanic women: (20.0%) – 123,918 estimated abortions.
Non-Hispanic women in the other race category: (7.7%) – 47,709 estimated abortions.
Live Action News plans to publish a more comprehensive analysis for this category in the coming days.
Gestational age
In 2018, nearly 6,200 babies (estimated) were aborted at or past the 21st week of pregnancy, according to CDC data. (Babies have survived when born prematurely as early as 21 weeks.) Gestational data was estimated below by calculating the total of 619,591 abortions and percentages reported from 42 reporting areas as follows:
9 weeks or less: (77.7%) – 481,422 estimated.
13 weeks or less: (92.2%) – 571,263 estimated.
14-20 weeks: (6.9%) – 42,752 estimated.
21 weeks or greater: (1.0%) – 6,196 estimated.
Abortion method
In 2018, 45 reporting areas sent data to CDC on abortion methods. Surgical abortion accounted for 52.1% of abortions at or less than 13 weeks’ gestation and 7.8% of abortion at greater than 13 weeks’ gestation. Medical (chemical) abortion accounted for 38.6% of early abortions at or less than 9 weeks’ gestation and 1.4% of abortions at greater than 9 weeks.
“Among the 37 reporting areas that included medical abortion on their reporting form and provided these data for the relevant years of comparison, use of early medical abortion increased 9% from 2017 to 2018 (from 34.7% of abortions to 37.7%) and 120% from 2009 to 2018 (from 17.1% of abortions to 37.7%),” the report states.
Age Groups
In 2018, women in their 20s accounted for more than half of abortions (57.7%). Women in the youngest (<15 years) and oldest (≥40 years) age groups accounted for the smallest percentages of abortions (0.2% and 3.6%, respectively) and had the lowest abortion rates (0.4 and 2.6 abortions per 1,000 women aged <15 and ≥40 years, respectively.
Previous abortions (40 reporting areas) and live births (43 reporting areas)
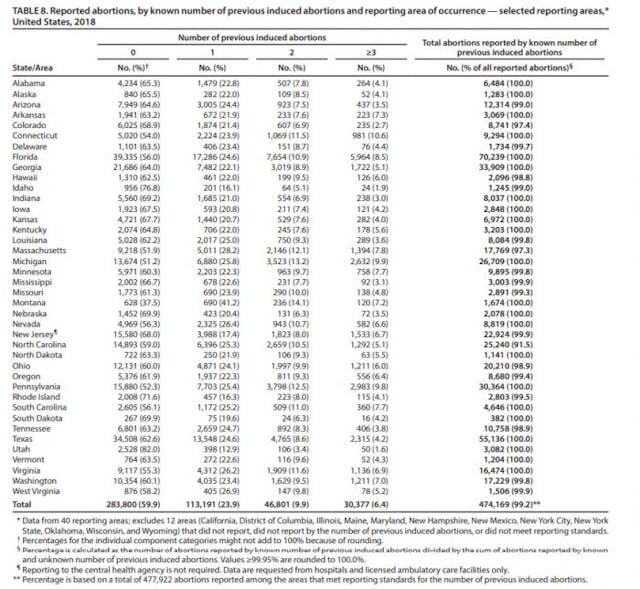
According to the CDC data, of the women who obtained abortions in 2018, nearly 60% had no previous abortions, nearly 24% had one previous abortion, nearly 10% had two previous abortions, and just over 6% previously had three or more abortions. Nearly 41% of women who obtained abortions in 2018 had no previous live births, according to the CDC report. Nearly 25% had one previous live birth, nearly 20% had two previous live births, and almost 15% had three or more previous live births.
Dr. Michael New credits the decline in abortions to the dedication of pro-life prayer and sidewalk counseling outside abortion facilities, as well as the powerful impact of pregnancy resource centers. According to an analysis published by the Charlotte Lozier Institute, in 2019, an estimated 2,700 pro-life pregnancy centers provided nearly two million people in the United States with free services, for an estimated total value of services at over $266 million. Out of that number of PRCs, the CLI report indicated that medical pregnancy centers have increased over 4000%, from 50 in 1998 to 2,132 in 2019.
Editor’s Note, 1/21/21: This post has been updated with further information.
“Like” Live Action News on Facebook for more pro-life news and commentary!
Live Action News is pro-life news and commentary from a pro-life perspective.
Contact editor@liveaction.org for questions, corrections, or if you are seeking permission to reprint any Live Action News content.
Guest Articles: To submit a guest article to Live Action News, email editor@liveaction.org with an attached Word document of 800-1000 words. Please also attach any photos relevant to your submission if applicable. If your submission is accepted for publication, you will be notified within three weeks. Guest articles are not compensated (see our Open License Agreement). Thank you for your interest in Live Action News!

Bridget Sielicki
·
Analysis
Nancy Flanders
·
International
Angeline Tan
·
Pop Culture
Cassy Cooke
·
International
Cassy Cooke
·
Analysis
Cassy Cooke
·
Abortion Pill
Carole Novielli
·
Investigative
Carole Novielli
·
Abortion Pill
Carole Novielli
·
Investigative
Carole Novielli
·
Human Rights
Carole Novielli
·